Quick tip: massif tool of Valgrind
 A little tip that I discovered some time ago: the
 massive tool from valgrind. It can address cases
where we have a program that eats up too much memory unnecessarily, but since it does cleanups correctly at the end, we don't
see anything with standard leak tools like valgrind or asan.
Massif
This is where the massif tool from valgrind comes in as well as the massif-visualizer visualization tool. This
tool will allow you to regularly take snapshots of memory allocations, and to see the callstacks of location in our programs
that make these allocations.
So we run the program with valgrind:
$ valgrind --tool=massif myprogram myarg1 myarg2...
And at the end of the execution we have a file massif.out.<pid> which contains the snapshots of the memory allocations. Please note
that it follows the principle of valgrind: a rewriting of the executable to add instrumentation, and therefore
when we fork, the child process is also instrumented.
Massif-visualizer
Very well we have traces, what next?
We use the massif-visualizer tool which allows us to see which functions have made memory allocations, for example
you can have something like this:
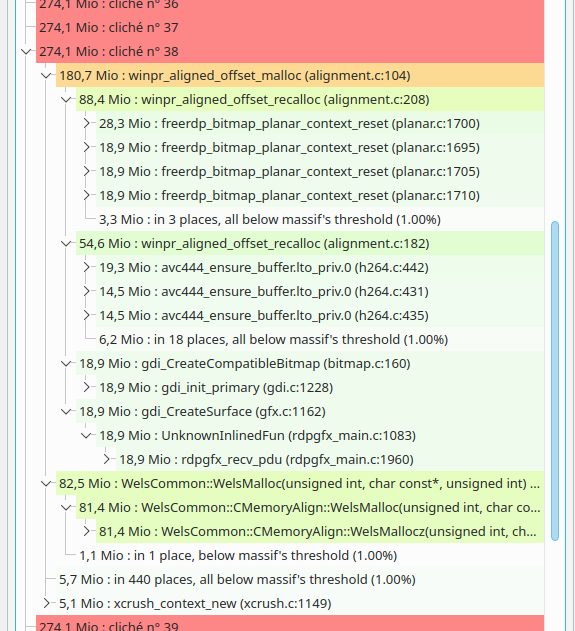
And so we can ask lots of questions like: are all these allocations justified? Is my program have become obese? Couldn't we give back some of this memory to be more friendly with the rest of the system?
Conclusion
In short, use massif !